It’s easy to forget the atmosphere that preceded the October 2025 collapse. Before the 50% flash crash wiped out billions in a single afternoon, the market for Dogecoin felt less like a financial instrument and more like a coiled spring. For weeks, the dogecoin price had been trapped in an unnervingly tight corridor, oscillating between roughly $0.24 and $0.27. It was the kind of sideways grind that drives traders to madness, a period of intense equilibrium where every minor dip was bought and every small rally was sold.
On-chain data confirmed the deadlock. Glassnode’s heatmaps showed enormous supply walls boxing the price in. Below, a thick cushion of 1.89 billion DOGE sat between $0.247 and $0.249, acting as a formidable floor. Above, a ceiling formed by another 2.6 billion DOGE between $0.261 and $0.264 seemed just as impenetrable. The market was perfectly, almost artificially, balanced. Derivatives data echoed this stasis; long and short positions were nearly identical (around $304 million vs. $331 million, respectively), meaning neither side had the leverage to force a decisive move.
This is the kind of setup that breeds narratives. With the price action offering no clues, analysts and influencers rushed to fill the void. The question on everyone’s mind was simple: which way would it break?
The Anatomy of a Bull Trap
In the absence of a clear trend, the bulls turned to technical patterns, searching for ghosts in the machine. They found one in a "bullish divergence" on the 4-hour chart—a setup where the price hits a new low while a momentum indicator like the RSI makes a higher low. This, they argued, was a sign of seller exhaustion. The narrative took hold that the Dogecoin Price Could Finally Rally as Bullish Divergence Appears. They pointed to a similar pattern a month prior, between September 22 and 26, which had preceded a 20% rally. The implication was clear: history was about to repeat itself. A similar 20% move would push the price of dogecoin to $0.29, shattering the overhead resistance and triggering a new uptrend.
This short-term optimism was merely the appetizer. The main course was served by analysts like Javon Marks, who saw not just a rally, but a history-defining surge, asking Why The Dogecoin Price Could Surge 3,690% To $9.8 This Bull Cycle. Marks’s analysis was predicated on a much grander pattern: the idea that Dogecoin’s price action follows a predictable cyclical path, specifically adhering to Fibonacci extension levels. He noted that in the previous two market cycles, DOGE had perfectly hit its 1.618 Fibonacci target. His charts suggested that this cycle’s target was around $2.28—an 800% increase from its stagnant price.
But why stop there? Marks offered an even more audacious projection. If Dogecoin were to repeat the magnitude of its previous bull run, he argued, the ultimate target wasn't $2.28, but $9.80. That represented a 3,690% surge. The charts, he claimed, looked "nearly identical" to the periods preceding past explosions. I've looked at hundreds of these fractal-based predictions over the years, and this is the part I find genuinely puzzling. They treat market history not as a guide to probabilities, but as a script that is destined to be re-enacted, regardless of changing macroeconomic conditions or market saturation. How much of this analysis was a sober reading of the data, and how much was simply an exercise in curve-fitting to produce the most spectacular headline possible?
The market, for its part, was eating it up. The symmetrical triangle on the daily chart became a vessel for everyone’s hopes. The pattern itself is one of indecision, but the narrative had already been written: the bullish divergence was the catalyst, the Fibonacci levels were the roadmap, and a price of nearly $10 was the destination. The entire thesis rested on the belief that a massive pool of buyers was just waiting for a signal to overwhelm the sellers. The market wasn't a scale weighing fundamentals; it was a pressure cooker, and everyone was betting it would explode upwards.
When the Data Turns Against You
On October 11, 2025, the pressure cooker didn't explode. The bottom fell out. The 50% flash crash that day was a brutal, swift refutation of the entire bullish narrative. The floor that on-chain data suggested was concrete—that 1.89 billion DOGE support level—turned out to be paper. It didn't just bend; it vaporized. The symmetrical triangle, that symbol of impending breakout, resolved itself in the most violent way possible: a catastrophic breakdown.
In retrospect, the warning signs were there, hidden in the very data the bulls were championing. The tight balance of longs and shorts wasn't necessarily a sign of consolidation before a move up; it was a sign of profound uncertainty. The massive supply walls weren't just resistance to be broken; they were evidence of a huge number of holders who were desperate to sell at or near their cost basis. The market wasn't coiled for a spring upwards; it was teetering on a knife's edge.
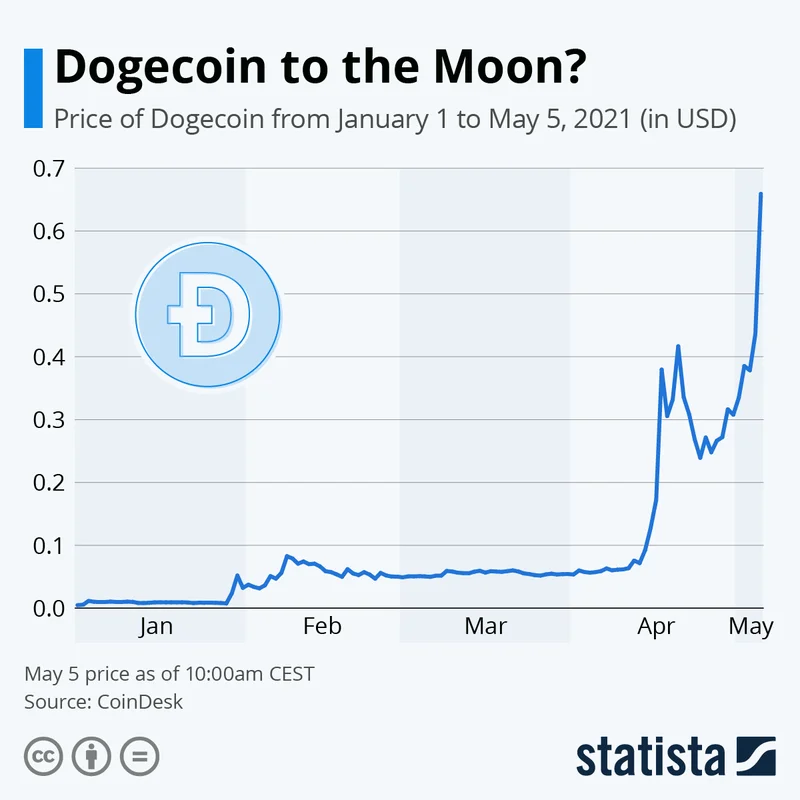
The reliance on historical patterns proved to be the fatal flaw. Believing that a chart pattern from 2021 (a vastly different market environment, with far less institutional capital and regulatory scrutiny) will perfectly replicate itself years later is an analytical fallacy. It’s like expecting a hurricane to follow the exact same path as the last one simply because the initial satellite images look similar. It ignores the countless other variables—atmospheric pressure, water temperature, wind shear—that determine the final outcome. In crypto, those variables are things like regulatory headwinds, competition from newer projects like Solana or even shifts in the price of Bitcoin, and the fickle nature of social media sentiment.
The crash invalidated the entire technical thesis in minutes. The bullish divergence was rendered meaningless. The Fibonacci targets became a punchline. The dream of a $9.80 dogecoin stock price evaporated, replaced by the grim reality of margin calls and liquidations. The event served as a stark lesson: on-chain data and technical indicators are useful for understanding the current state of a market—where supply is, what traders are betting on—but they are terrible predictors of the future, especially when confronted with a sudden, overwhelming wave of selling pressure.
Gravity Always Wins
In the end, the story of Dogecoin's pre-crash hype and subsequent collapse is a timeless one. It's a case study in how narrative can hijack data analysis. The charts didn't lie; they showed a market in a state of perfect, fragile balance. The error was in the interpretation. Analysts, influencers, and hopeful investors chose to see that balance as the quiet before a storm upwards, ignoring the equal probability that it was the calm before the cliff. They mistook historical correlation for causal destiny. The 50% crash wasn't a black swan event; it was a simple, brutal lesson in financial gravity. When an asset's price is held aloft by little more than memes and speculative chart patterns, its eventual return to earth is not a possibility, but an inevitability.
